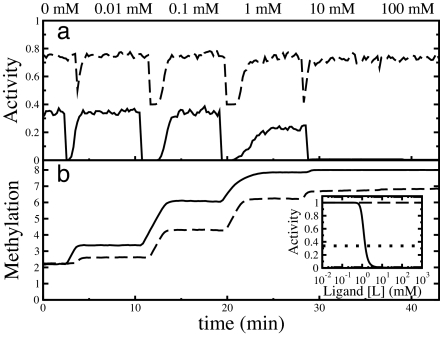
Fig. 6.
Adaptation of a homogeneous cluster of 18 receptors for different values of Koff: 0.018 (solid line) and 0.06 (dashed line) mM. The remaining parameters correspond to Tar and MeAsp values. (a) Response of receptor activity to progressive step increases in attractant concentration (0–100 mM). Solid curve is raised vertically by 0.4. (b) Corresponding average receptor methylation levels. (Inset) Activity as a function of attractant concentration for fully methylated receptors. The steady-state activity of adapted receptors is indicated by the dotted line.

