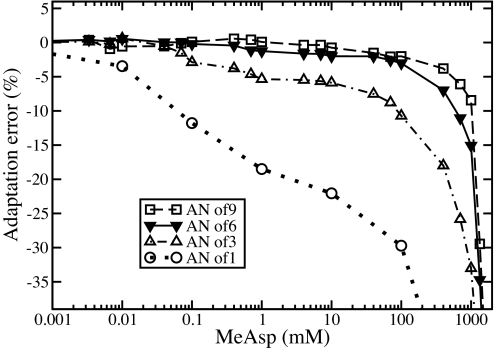
Fig. 7.
Adaptation error [A([MeAsp]) − A(0)]/A(0), where A is the time-averaged receptor activity, for increasing assistance neighborhood (AN) sizes of 1, 3, 6, and 9 receptors, for a mixed cluster of 6 Tar and 12 Tsr receptors. Each AN has the same Tsr:Tar ratio of 2:1, except when the AN size is 1.

