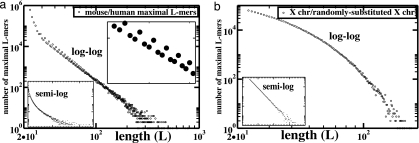
Fig. 1.
Distributions of perfectly conserved sequence lengths in genomic intersections. (a) Log–log plot of the number of distinct maximal L-mers from mouse/human whole-genome intersection. The Inset at the lower left shows the same data on a semilogarithmic scale. The Inset at the upper right expands the small-L regime to show the 3-fold modulation clearly. (b) Log–log plot of the intersection of mouse X chromosome with a version of itself that has been randomly mutated at a rate of 0.1 substitutions per base.

