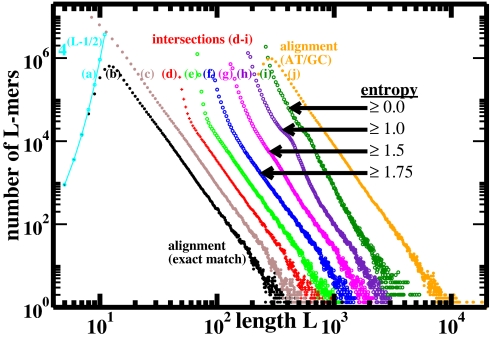
Fig. 2.
Length distributions (three-point running averages) of perfectly conserved L-mers from mouse/human genome alignment and intersection. Curve a, maximum possible number of distinct mers of length L (cyan); curve b, whole-genome alignment from UCSC, for L ≥ 4 (hg17/mm6): distinct sequences (black); curve c, same whole-genome alignment: all sequences (brown); curve d, intersection of repeat-masked genomes (red). No RepeatMasker: curve e, distinct maximal L-mers in intersection containing no 23-mer subsequence that occurs more than once in either genome (green); curves f–i, single-copy maximal L-mers in intersection with entropy of base composition exceeding selected values in bits (blue, magenta, violet, and dark green); curve j, (repeat-masked) whole-genome alignment as in curve b, allowing A/T and G/C substitutions within an L-mer (orange). Except for curve a, distributions are offset in the horizontal direction from the whole-genome alignment (curve b) for clarity of presentation; otherwise the linear regimes of curves b–f would fall right on top of one another.

