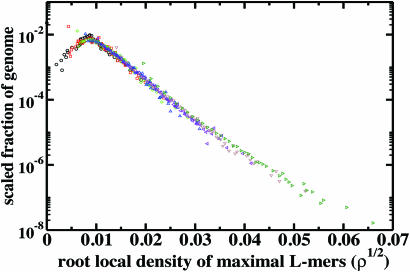
Fig. 4.
Scaling function h for the fraction f of repeat-masked mouse genome (y axis) with a given local density of maximal L-mers ρ (x axis). Note that a square-root has been taken on the x axis. A stretched exponential is observed, whereas a spatially random choice of positions in the repeat-masked mouse genome yields the expected Gaussian, with a quartic decay on this plot (data not shown). Window lengths are 2n for n = 14 (dark green), 15 (brown), 16 (violet), 17 (blue), 18 (green), 19 (red), and 20 (black).

