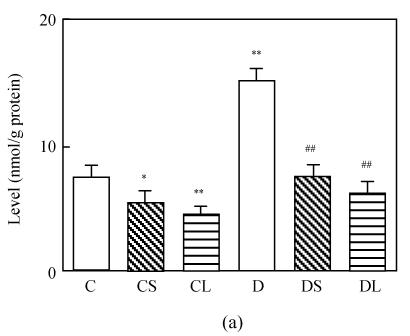
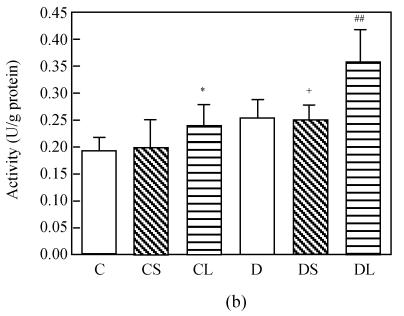
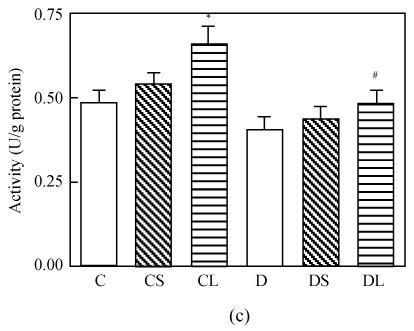
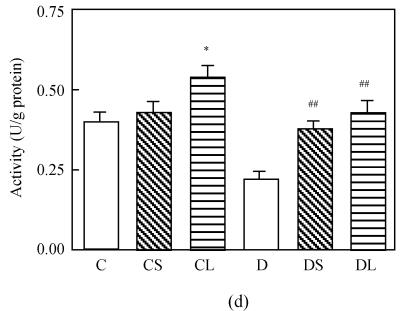
Fig. 1.
Malondialdehyde (MDA) levels (a), activities of CAT (b), activities of GSH-Px (c) and activities of SOD (d) in the heart tissue of normal controls (C), normal rat treated with small dose of carvedilol (1 mg/kg) (CS), normal rat treated with large dose of carvedilol (10 mg/kg) (CL), untreated diabetic rat (D), diabetic rat treated with small dose of carvedilol (DS), diabetic rat treated with large dose of carvedilol (DL)
Each bar represents the mean±SD; * P<0.05 vs C; ** P<0.01 vs C; # P<0.05 vs D; ## P<0.01 vs D; + P<0.05 DS vs DL


