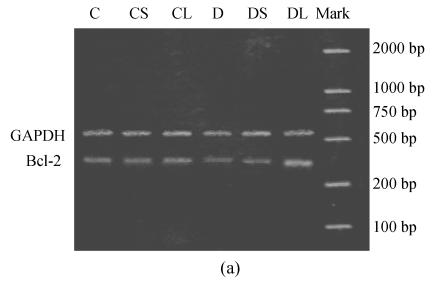
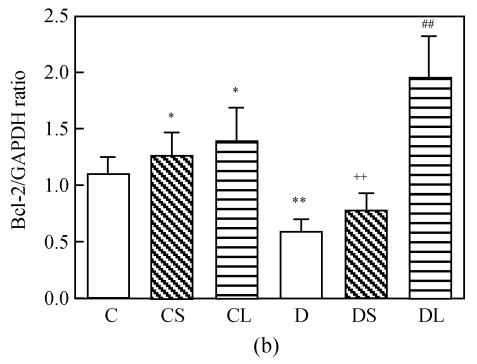
Fig. 2.
Semiquantitative RT-PCR analysis of Bcl-2 mRNAs in the heart tissue of normal controls (C), normal rat treated with small dose of carvedilol (CS), normal rat treated with large dose of carvedilol (CL), untreated diabetic rat (D), diabetic rat treated with small dose of carvedilol (DS), diabetic rat treated with large dose of carvedilol (DL). (a) Expression of Bcl-2 mRNAs; (b) Semiquantitative RT-PCR analysis of Bcl-2 mRNAs
Each bar represents the mean±SD; n=5 for each group; * P<0.05 vs C; ** P<0.01 vs C; ## P<0.01 vs D; ++ P<0.01 DS vs DL


