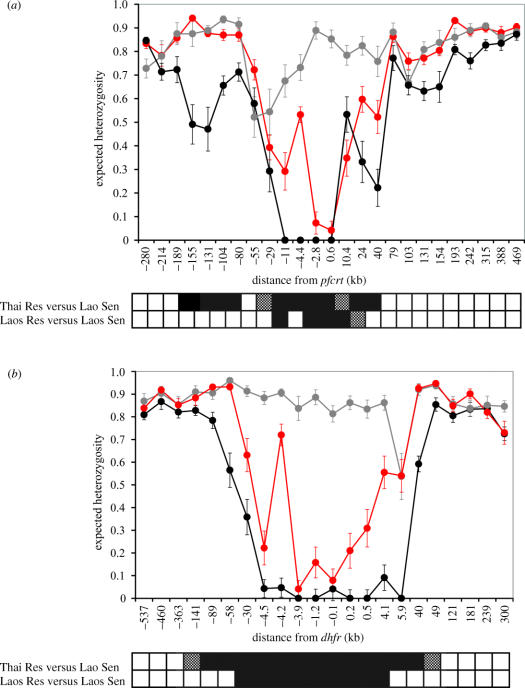
Figure 2.
Patterns of genetic variation around pfcrt and dhfr. (a) and (b) show He (±1 s.d.) plotted against position on the chromosomes relative to pfcrt (chromosome 7) and dhfr (chromosome 4). The markers are ordered along the x-axis, which is not linear. Chromosomes bearing wild-type alleles are shown in grey, those bearing resistant alleles are shown in red (Laos) or black (Thailand). The distance from pfcrt and dhfr at which He differs significantly (p<0.01) between wild-type and resistant chromosomes is shown in the bars underneath the graph. Significance values were derived by permutation: black, p<0.001; stippled, p<0.01.

