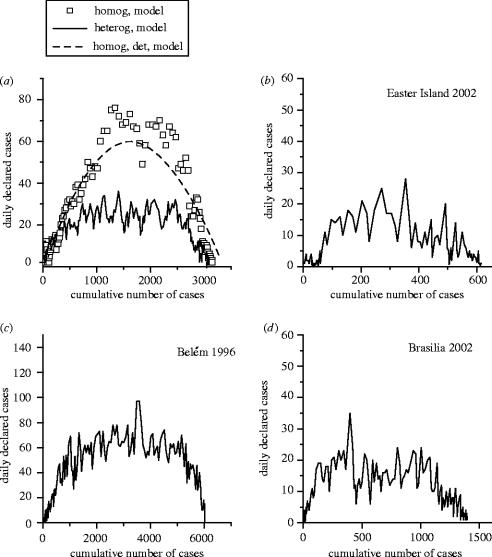
Figure 3.
Epidemiological curves: new cases declared daily versus cumulative number of cases. (a) Individual-based modelled epidemics, with and without household heterogeneity. The dashed line represents the pattern of the homogeneous model written in differential equations. (b–d) Real epidemics in the Easter Island, in Belém and in Brasília. As in the heterogeneous model, a plateau follows an initial linear growth before extinction.

