
Figure 2.
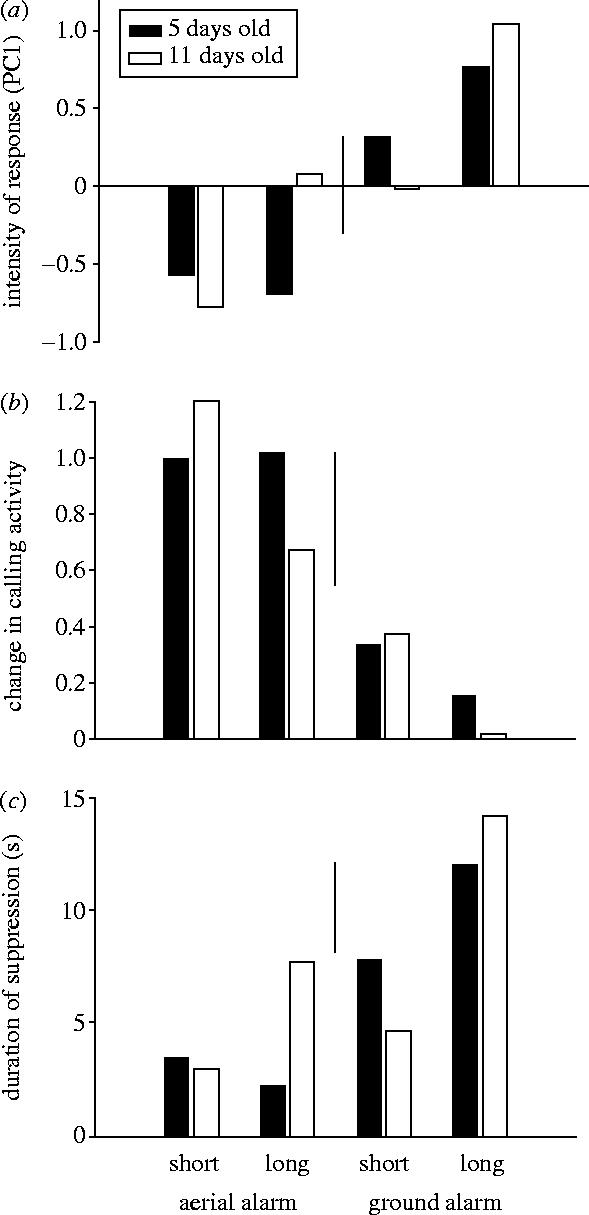
Response of 5- and 11-day-old nestlings to playback of ground (‘buzz’) and aerial (‘trill’) alarm calls. Bars show estimated means of the restricted maximum-likelihood analyses; lines between bars show the least significant difference (two times the standard error of the difference). (a) Intensity of the response shown as the first factor of a principal component analysis of ‘number of calls’ and ‘latency’; more positive values indicate a greater suppression of vocalization. (b) Change in vocal activity shown as the ratio of the number of calls given during the 15 s interval after the experimental playbacks divided by the number of calls given in the 15 s interval before the playbacks. A value of 0 indicates complete suppression of vocalization and a value of 1 indicates no change at all. (c) Duration of suppression after the end of an alarm-call playback; greater values indicate greater suppression of vocalization.