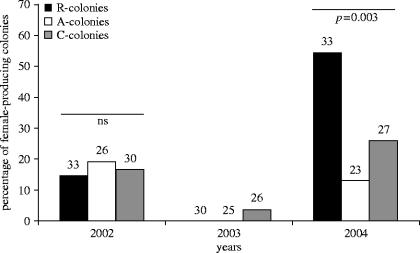
Figure 2.
Percentage of colonies that produced gynes for the three treatments across the three breeding seasons. R-colonies, colonies where queens were removed; A-colonies, colonies where queens were added; C-colonies, colonies where queen number was not manipulated. Numbers above the columns indicate the total number of nests per treatment where sexuals were produced.

