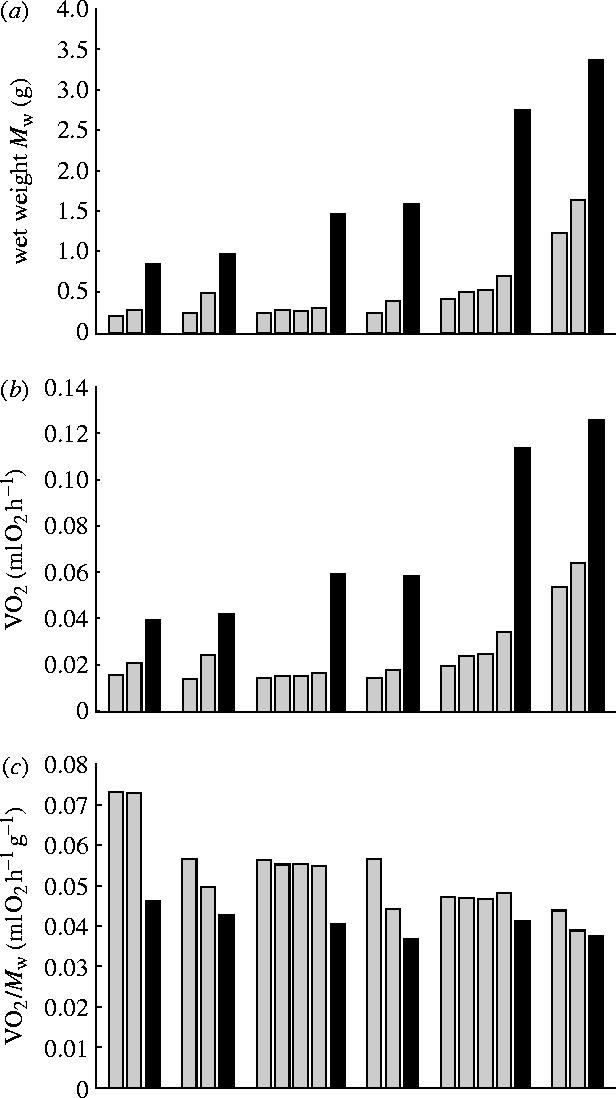
Figure 3.

Fusing experiment. (a) wet weight, (b) oxygen consumption rate (VO2) and (c) mass specific oxygen consumption rate (VO2/Mw). Six sets of experiments are shown. A filled bar denotes the value of the colony after fusion and the two or four grey bars to the left of the filled bar denote the values of the smaller colonies that were fused together. Note the VO2/Mw value decreased after fusion in every set.
