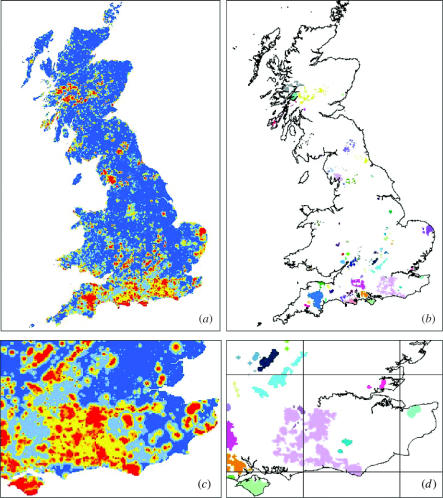
Figure 2.
(a) Landscape prioritization zones for British butterflies. Colour-scale from low to high priority (cumulative percent of landscape removed when the focal cell is removed): dark blue 0–60%, light blue 60–80%, yellow 80–90%, orange 90–95% and red 95–100%. (b) Priority landscape groupings based on the top 10% zone. Each landscape (shown by a colour) contains blocks of land that are close together, similar in species composition, and contain a core area present late in the cell removal process (see §2). (c) and (d) show partial enlargements of (a) and (b). Lines in (d) show 100 km OS National Grid.

