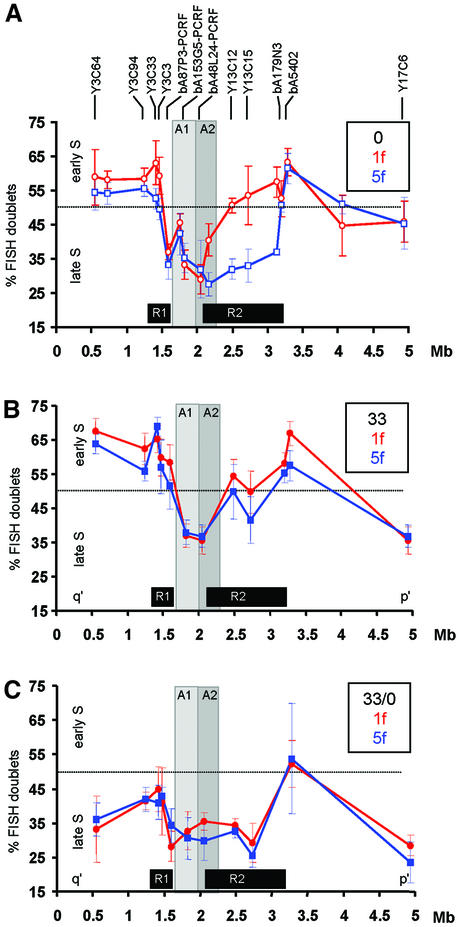
Fig. 4. Replication timing at the 10q25 neocentromere region. (A) No TSA treatment (0; data taken from Lo et al., 2001a). (B) Cells treated for 17 h with 33 nM TSA (33). (C) Cells treated for 17 h with 33 nM TSA followed by culture without TSA for 3 days (33/0). Average percentages of S phase FISH signal doublets (inversely proportional to replication time) for each probe are plotted against the midpoint position of each probe (shown above the graph) within the 5 Mb 10q25 contig for 1f (normal chromosome 10; red circles) and 5f [mardel(10); blue squares]. Results from untreated cells (0; Lo et al., 2001a) are shown with open symbols; results from TSA-treated cells obtained in the present study are shown as filled symbols. The dotted horizontal line at 50% FISH doublets represents the approximate mid-S phase time-point. Minimal CENP-A-binding domains before and after TSA-treatment are designated A1 and A2 and shown as light and darker grey areas, respectively. R1 and R2 boxes denote the regions of differentially delayed replication on mardel(10) compared with normal chromosome 10 in the absence of TSA (Lo et al., 2001a). Results are the averages ±1 SD of four separate experiments. Experiments for the untreated cells reported previously (Lo et al., 2001a) and the TSA-treated cells presented here were performed, and the two data sets collected and analysed, simultaneously.

An official website of the United States government
Here's how you know
Official websites use .gov
A
.gov website belongs to an official
government organization in the United States.
Secure .gov websites use HTTPS
A lock (
) or https:// means you've safely
connected to the .gov website. Share sensitive
information only on official, secure websites.
