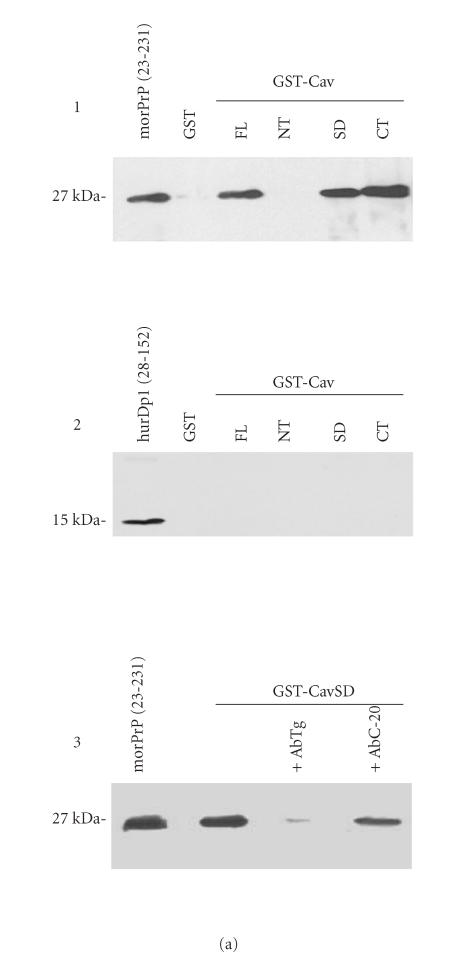
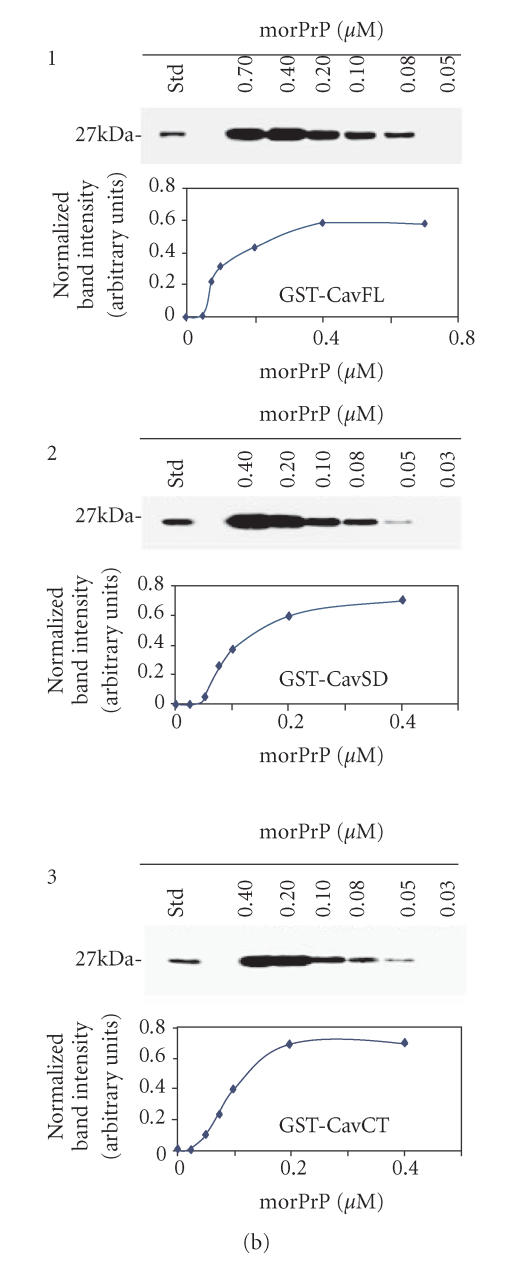
Figure 1.
(a) In vitro interaction between Cav-1 andmorPrP. To assess the binding of morPrP (23–231) and hurDpl (28–152) to different Cav-1 domains (CavFL: full-length form (1–178); CavNT: N-terminal domain (1–81); CavSD: scaffolding domain (61–101); CavCT: C-terminal domain (135–178)), prion proteins were incubated with equimolar amounts (0.2 μM) of GST-Cav fusions bound to glutathione-Sepharose beads. Bound morPrP (1, 3) and hurDpl (2) were then visualized by western blotting with Mab 3F4 and polyclonal antibody Q55, respectively. In 3, the binding assay was carried out in the presence of polyclonal antibodies (0.2 μM) to PrP, namely, Ab · Tg recognizing the octapeptide region, and C-20 directed against the C-terminus. In the first lane of (a) 1, 2, 3, 50 ng morPrP or hurDpl were added as standard, while in the second lane of (1) and (2) GST alone (ie, not fused to Cav-1) was used for the binding experiments as negative control. Data shown are representative of three independent experiments. (b) Evaluation of Kd values of morPrP/Cav-1 complexes. Increasing concentrations of morPrP (0.03–0.7 μM) were incubated with GST-Cav 1 fusion proteins: CavFL in 1, CavSD in 2, and CavCT in 3, as described under Materials and Methods. The upper parts of (b) 1, 2, 3 show the results of western blotting experiments performed with anti-PrPc antibody (3F4). Lane 1, morPrP used as standard; lanes 2–7, 50 pmoles of GST-Cav 1 fusion proteins, CavFL in 1, CavSD in 2, and CavCT in 3, were incubated with the indicated amounts of morPrP (final volume 250 μl). In lower parts of each panel, the concentration of morPrP used in binding assays was plotted as a function of band intensity, which was quantified using ImageMaster VDS Software (Pharmacia Biotech, Sweden). The dissociation constants calculated from each plot ranged from 8 to 9 × 10⁸ M−1 The data are representative of two independent experiments.


