Figure 2.
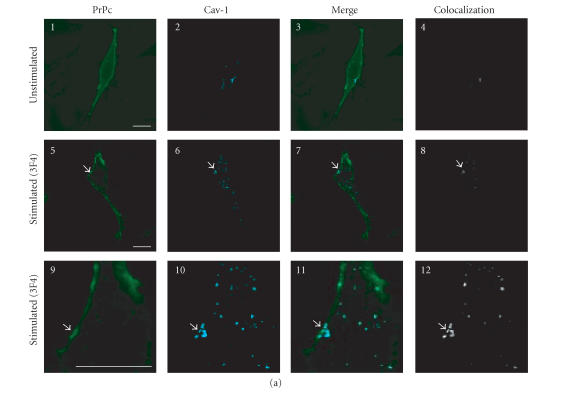
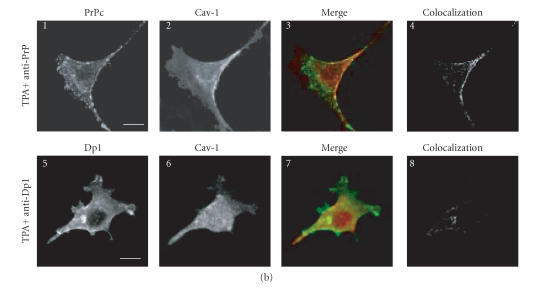
Confocal microscopy analysis of PrPc, Dpl, and Cav-1 distribution in GN11 cells transfected with morPrP or hurDpl. (a) PrP coverexpressing GN11 cells were fixed (1–4) and incubated with anti-PrP Mab 3F4 and with secondary FITC-conjugated antibody to allow the visualization of PrPc on the plasma membrane of unstimulated cells (1). Then cells were permeabilized and incubated with anti-Cav- 1 Pab to visualize Cav-1 distribution (2). Live GN11 cells PrPc transiently transfected were incubated with anti-PrP Mab 3F4 (30 min), followed by secondary FITC-conjugated antibody (30 min) (5–8, corresponding to 9–12 after magnification) to allow antibody-mediated ligation (and visualization) of PrPc (5), (9). After fixing, cells were permeabilized and incubated with anti-Cav-1 Pab and secondary CY5- conjugated antibody to visualize Cav-1 distribution ((6), (10)). Superposition of green PrPc ((1), (5), and (9)) and cyan-blue Cav-1 ((2), (6), and (10)) signals provided the images shown in 3, 7, and 11. The binary maps presented in 4, 8, and 12 are a more precise means to evaluate colocalization, whereby only those regions, in which PrPc and Cav-1 are copresent above a defined threshold of fluorescence intensity, appear.Micrographs show a single confocal plane. Arrowheads indicate PrPc clusters where Cav-1 is also present. Bar = 40 μm. (b) The same protocol used to analyze PrPc and Cav-1 distribution in GN11 cells in (a) was applied to GN11 cells stimulated by TPA (20 nM, 48 h) (1–4). Note that TPA treatment increases surface colocalization of PrPc (green) and Cav-1 (red) ((3), (4)). When the same methods were used to analyze the distribution of Dpl (green) and Cav-1 (red) in Dpl-transfected cells activated by anti-DplMab 79 antibody (5–8), no evident proteins colocalization was found ((7), (8)). For other experimental details see Material and Methods. Images result fromintegrating different optical sections. Bar = 5 μm.


