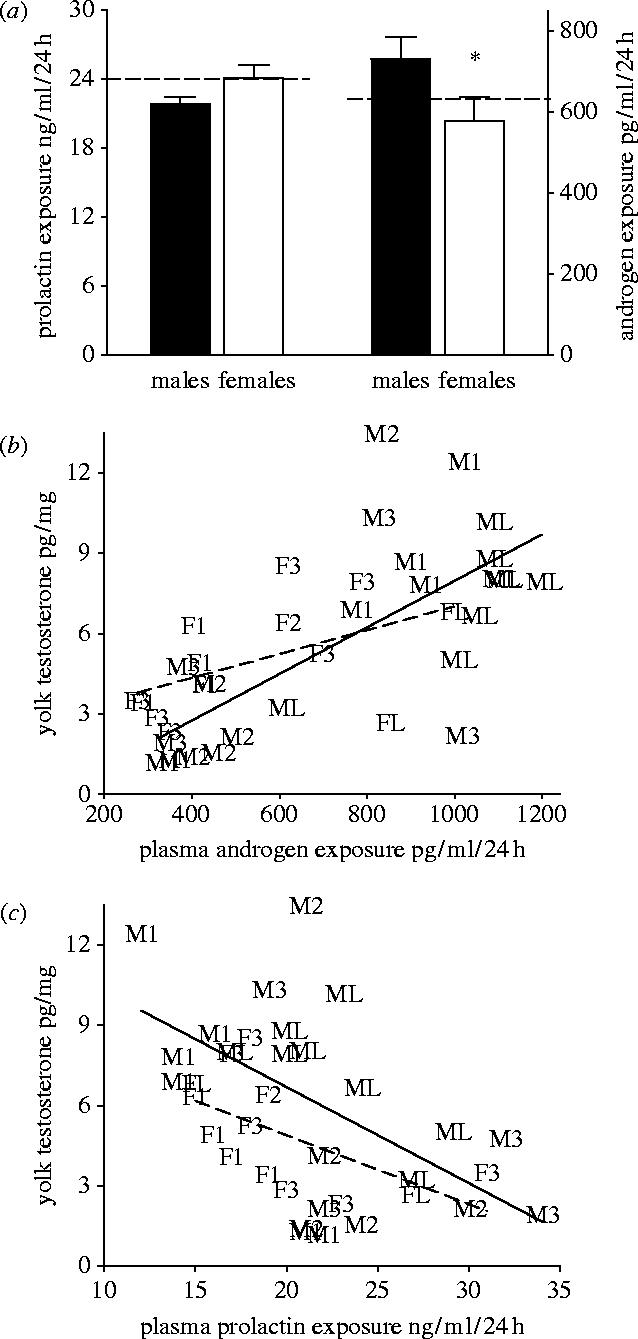
Figure 4.

(a) Mean daily concentrations of female plasma PRL and androgen during RYD phase of male (n=36) and female (n=33) oocytes. Dashed line indicates average level of PRL (left) and androgens (right) throughout the oocytes' RYD phase. (b) Relationship between mean daily concentrations of plasma androgens of the mother throughout an oocyte's RYD phase and the total concentration of androgens in the yolk of this oocyte (male oocytes, solid line; female oocytes, dashed line). (c) Relationship between mean daily plasma PRL concentrations throughout an oocyte's RYD phase and total concentrations of androgens in the yolk of this oocyte (male oocytes, solid line; female oocytes, dashed line). Letter followed by number indicates sex (Male or Female) and order of ovulation (1, 2, 3, last).
