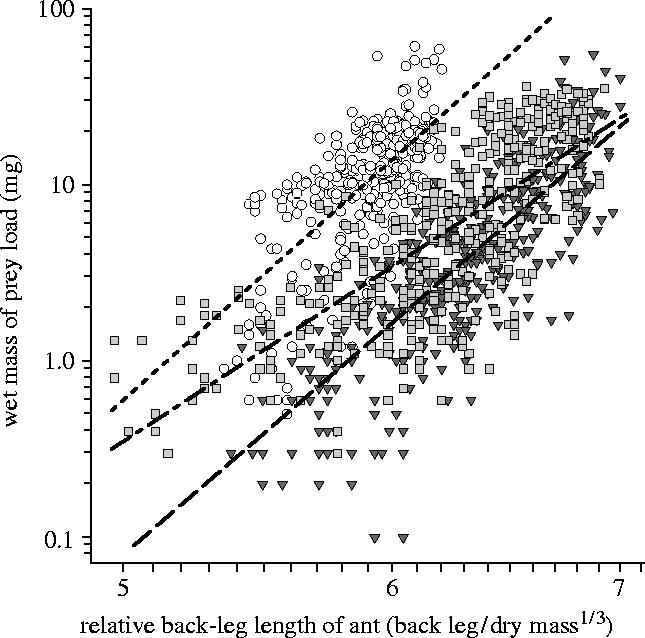
Figure 1.

Loading efficiency (relationship between ant size and load size) for natural prey-transport in E. burchellii (grey triangles, dashed regression line), E. hamatum (light grey squares, dashed/dotted regression line), and E. dulcium (white circles, dotted regression line). The difference in the loading efficiency achieved by the three species was highly significant (species effect, F2,1192=536.65, p<0.0001, η2=47%; interaction term, F2,1192=16.51, p<0.0001, η2=3%). Pairwise comparisons showed E. burchellii's loading efficiency was significantly lower than that of E. hamatum (species effect, F1,796=115.65, p<0.0001, η2=13%; interaction term, F1,796=23.42, p<0.0001, η2=3%) and E. dulcium (species effect, F1,795=1493.93, p<0.0001, η2=65%). Loading efficiency was also significantly different between E. hamatum and E. dulcium (species effect, F1,794=669.91, p<0.0001, η2=46%; Interaction term, F1,794=14.54, p=0.0001, η2=2%). Loading efficiency was not significantly different among E. burchellii colonies. Significant differences were found among both E. hamatum colonies (colony effect, F3,392=35.02, p<0.0001, η2=20%; interaction term, F3,392=5.29, p=0.0014, η2=4%) and E. dulcium colonies (colony effect, F3,393=17.74, p<0.0001, η2=12%). However, for all species, the data from all four colonies were used in the main ANCOVA, so that the data set for each species retained the full natural variation in loading efficiency.
