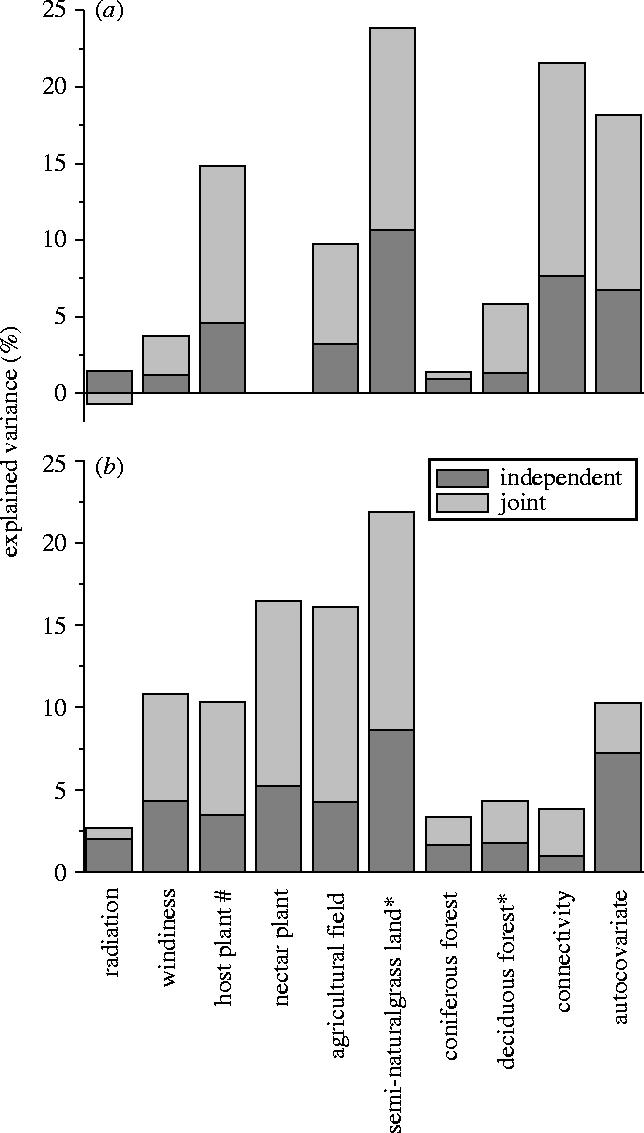
Figure 2.

The independent and joint contributions (given as the percentage of the total explained variance) of the predictor variables for (a) the occupancy and (b) the abundance of P. mnemosyne, as estimated from hierarchical partitioning. Data on the nectar plant abundance were only available for (b); #=log-transformed variable, *=square root transformed variable.
