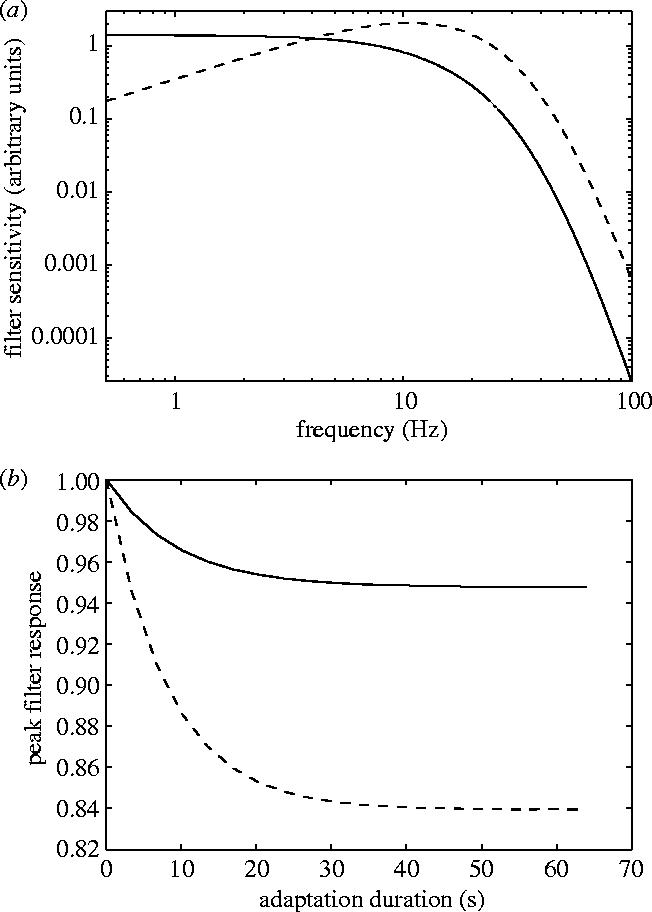
Figure 1.

(a) The filter sensitivities for p (solid line) and m (broken line) are shown. (b) The decay of peak filter response as a function of adaptation duration is illustrated for cases of near-optimal adaptation (i.e. at values of ωa close to peak filter sensitivity). The decay functions have been normalized with respect to peak filter response. The decay functions are shown for p (solid line) at ωa=2 Hz and for m (broken line) at ωa=12 Hz using the best fit of the model to data averaged over both subjects.
