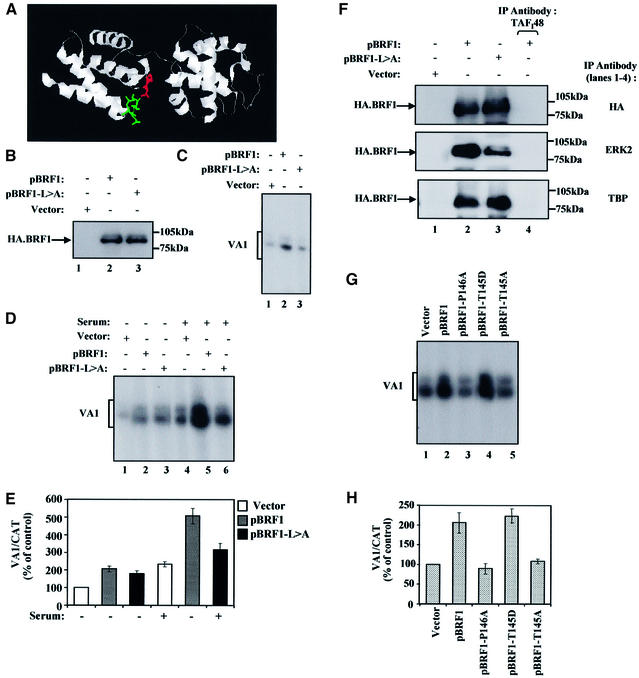
Fig. 7. Mutating ERK2 docking and phosphoacceptor sites on BRF1 prevent serum induction of pol III transcription. (A) Structure of TFIIB showing where the putative docking domain and phosphoacceptor sites are predicted to lie on BRF1. The docking domain (green) lies on a loop between the first and second α-helices, whilst the phosphoacceptor site (red) lies on the loop between the third and fourth α-helices. (B) 3T3 cells were transiently transfected with 3 µg of pCDNA3HA (lane 1), pBRF1 (lane 2) or pBRF1-L>A (lane 3). Cell extracts were resolved by SDS–PAGE and immunoblotted with antibody F-7 against the HA tag on BRF1 to compare expression levels. (C) 3T3 cells growing in 10% serum were transiently transfected with pVA1 (0.5 µg, all lanes), pCAT (0.5 µg, all lanes), pCDNA3HA vector (3 µg, lane 1), pCDNA3HA.BRF1 (pBRF1) (3 µg, lane 2) or pBRF1-L>A (3µg, lane 3). VA1 and CAT levels were assayed by primer extension and VA1 levels are shown. (D) 3T3 cells growing in 10% serum were transiently transfected for 48 h with pVA1 (0.5 µg, all lanes), pCAT (0.5 µg, all lanes), pCDNA3HA vector (3 µg, lanes 1 and 4; 2 µg, all other lanes), pCDNA3HA.BRF1 (pBRF1) (1 µg, lanes 2 and 5) or pBRF1-L>A (1 µg, lanes 3 and 6). During the final 16 h of transfection, the cells were either maintained in the same medium (lanes 4–6) or in medium containing 0.5% serum (lanes 1–3). VA1 and CAT levels were assayed by primer extension and VA1 levels are shown. In all cases, CAT levels remained constant. (E) VA1 and CAT levels were quantified by PhosphorImager. Values presented graphically are means and standard deviations for VA1 expression after normalization to the levels of CAT RNA to correct for transfection efficiency; the activities obtained for cells transfected with pCDNA3HA alone (lane 1) were set at 100 and other values were calculated as a percentage of this. (F) Extracts from cells transfected as in (B) were immunoprecipitated with anti-TAFI48 antibody M-19 (all panels, lane 4), anti-TBP antibody (lower panel, lanes 1–3), anti-HA antibody F-7 (upper panel, lanes 1–3), or antibody D-2 against ERK2 (middle panel, lanes 1–3). The samples were resolved by SDS–PAGE and analysed by western blotting with antibody F-7 against the HA tag on transfected BRF1. (G) 3T3 cells were transiently transfected for 48 h with pVA1 (0.5 µg, all lanes), pCAT (0.5 µg, all lanes), pCDNA3HA vector (3 µg, lane 1; 2 µg, all other lanes), pCDNA3HA.BRF1 (pBRF1) (1 µg, lane 2), pBRF1-P146A (1 µg, lane 3), pBRF1-T145D (1 µg, lane 4) or pBRF1-T145A (1 µg, lane 5). VA1 and CAT levels were assayed by primer extension and VA1 levels are shown. In all cases, CAT levels remain constant. (H) VA1 and CAT levels were quantified by PhosphorImager. Values from three independent experiments are presented graphically, as before.

An official website of the United States government
Here's how you know
Official websites use .gov
A
.gov website belongs to an official
government organization in the United States.
Secure .gov websites use HTTPS
A lock (
) or https:// means you've safely
connected to the .gov website. Share sensitive
information only on official, secure websites.
