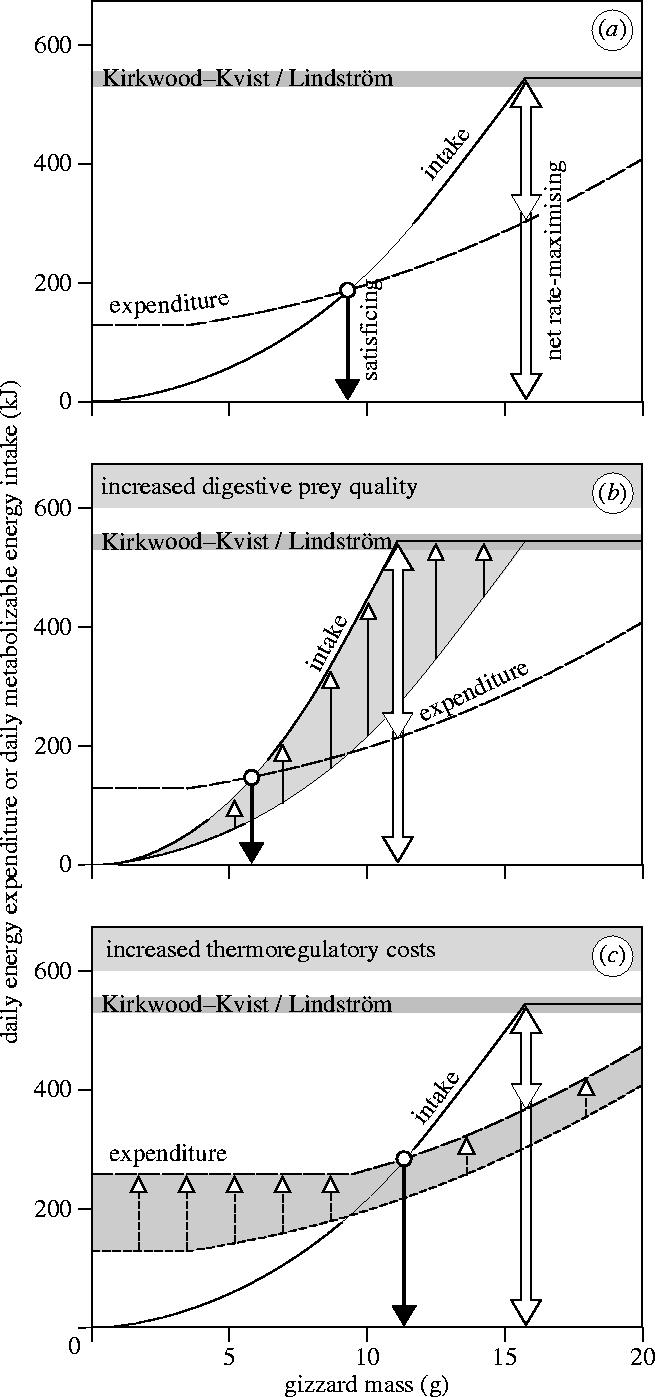
Figure 2.

Daily energy expenditure and daily metabolizable energy intake as a function of gizzard size, to demonstrate the two optimal gizzard sizes. (a) Intake increases quadratically with gizzard mass up to a level constrained by other processes in the physiology of digestion (Kirkwood–Kvist/Lindström bar). The optimal satisficing gizzard mass is at the intersection of the two curves, indicated by the solid, left arrow. Net daily energy intake is maximized when (gross) daily intake hits the Kirkwood–Kvist/Lindström constraint; the open, right arrow points at the optimal net rate-maximizing gizzard mass (where the upper part of the arrow indicates the maximum net daily energy intake). The parameters in this example are given standard values for TRC (1 W) and prey quality (1 kJ g−1 DMshell). (b) An enhanced intake (through a higher digestive prey quality of 2 kJ g−1 DMshell) decreases both the satisficing and the net rate-maximizing gizzard mass. (c) An increased expenditure level (through a higher TRC of 2.5 W) increases the satisficing gizzard mass but not the net rate-maximizing gizzard mass. Note that costs scarcely increase at the lowest gizzard sizes because all of the HIF produced by small gizzards is assumed to substitute for TRC.
