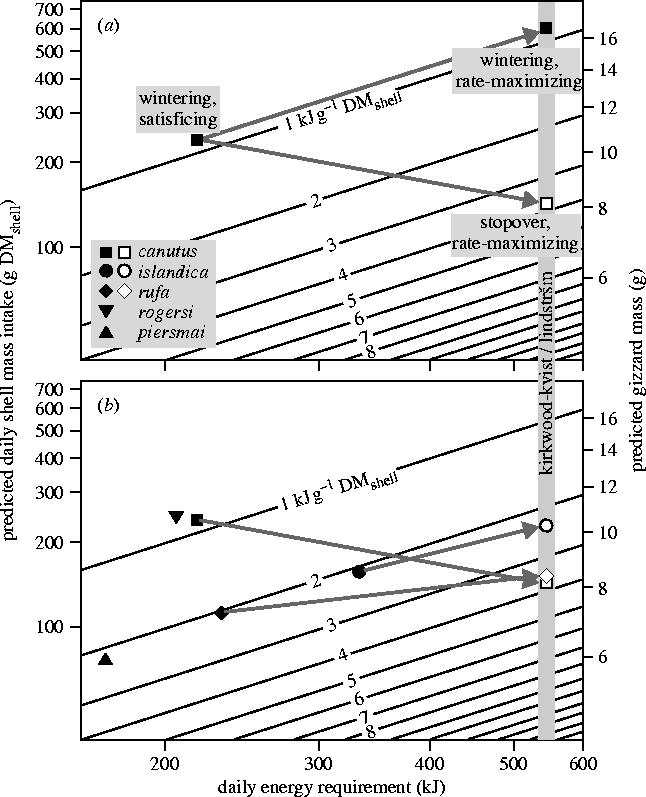
Figure 3.

Daily energy requirement (horizontal axis) and prey quality (diagonal lines) predict the daily mass of shell material processed (left vertical axis) and thus predict the required gizzard size (right vertical axis). (a) The prediction for satisficing and rate-maximizing C. c. canutus, both at wintering (filled squares) and stopover sites (open squares). Arrows indicate the expected change in gizzard mass when changing from wintering/satisficing conditions to wintering/rate-maximizing or to stopover/rate-maximizing conditions. (b) Predictions for all subspecies (ignoring rate-maximization during winter). Due to an increase in prey quality, little change in gizzard size is required when shifting from wintering to stopover sites (arrows). Note that the gizzard scale is based on 12 h of foraging per day, which holds for all cases except for wintering rogersi (15 h) and stopping-over islandica (14.2 h). In these two cases, predicted gizzard mass is actually somewhat smaller than plotted here ( and times the plotted gizzard mass).
