
Figure 1.
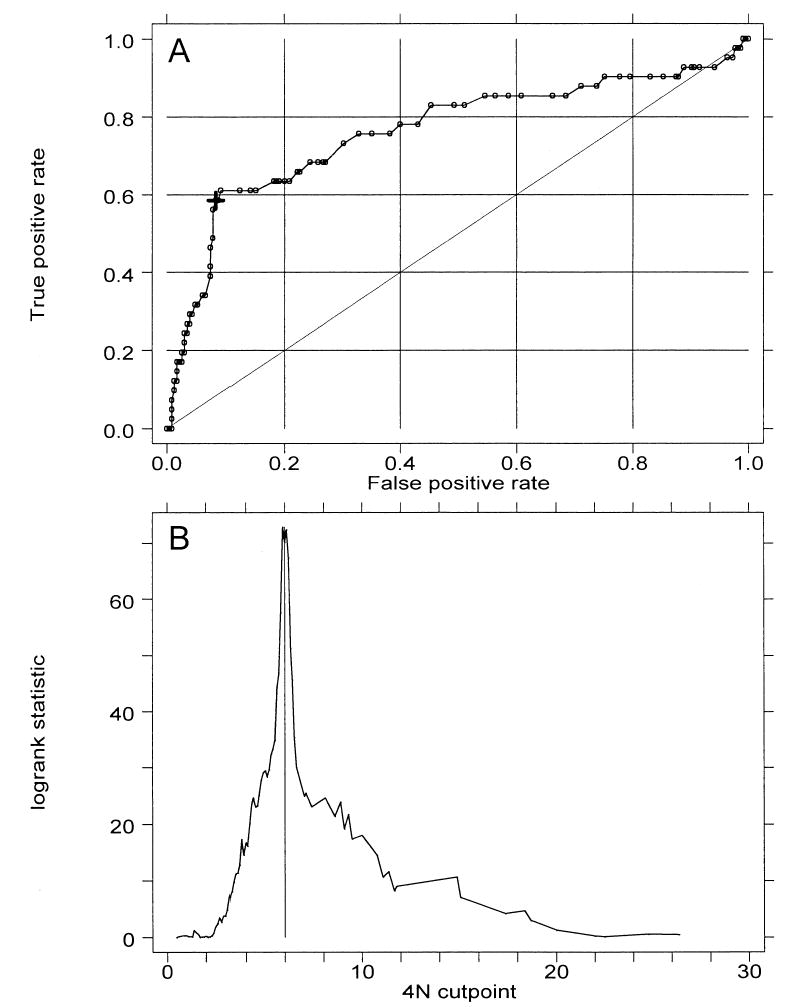
(A) Receiver operating characteristic (ROC) curve for prediction of cancer outcome by 4N fractions. The large cross indicates a cut point of 6%. Area under ROC curve is 0.76. (B) Plot of two-sample log-rank test statistic for cancer outcome as a function of 4N cut point. Vertical line marks maximal χ2 at 6%.