
Fig. 4.
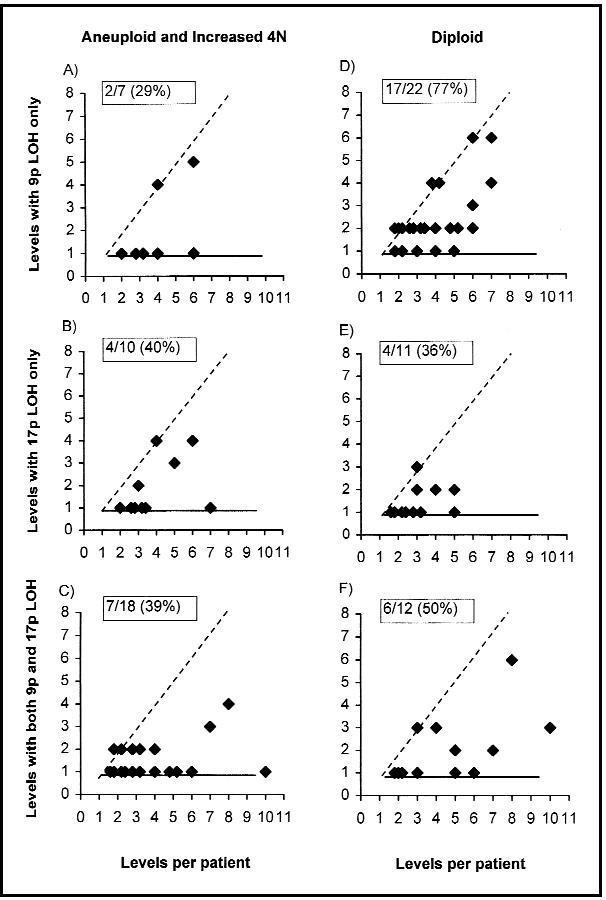
Expansion of loss of heterozygosity (LOH) at 9p and 17p chromosomes with and without flow-cytometric abnormalities. The levels with LOH (y-axis) in each flow-cytometric category (increased 4N and/or aneuploid [panels A– < C] or diploid [panels D– < F]) were plotted against the number of (2-cm) levels evaluated for each patient (x-axis). The number of 2-cm levels evaluated varies relative to the Barrett’s segment length. Samples with 9p LOH only are plotted on panels A and D, 17p LOH are plotted only on panels B and E, and both 9p LOH and 17p LOH are plotted together on panels C and F. Points on the dashed diagonal line have undergone complete expansion within the Barrett’s segment, points on the horizontal have not undergone expansion, and clones in between have undergone incomplete expansion. The percent of clones with expansion is given in the upper left corner of each graph.