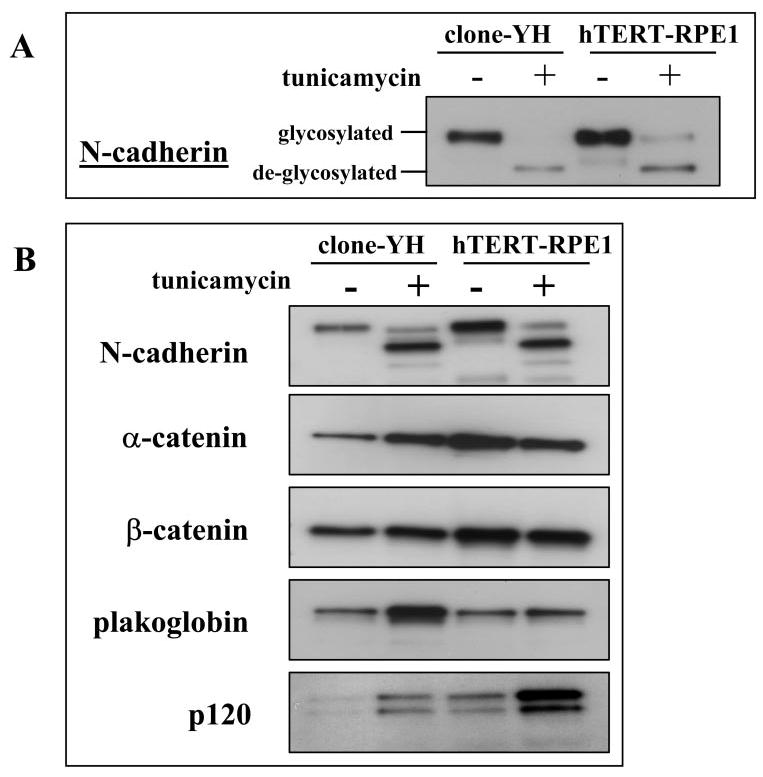
Figure 10.

N-cadherin glycosylation state, cell-surface localization, and catenin complex composition. (A) Immunoblot analysis of N-cadherin in the biotinylated fraction of extracts prepared from early cultures of clone-YH or hTERT-RPE1, untreated or treated with tunicamycin, showing that both glycosylated and deglycosylated N-cadherin is found on the cell surface of both cell types. (B) N-cadherin immunoprecipitates of extracts from early cultures of clone-YH or hTERT-RPE1 cells, untreated or treated with tunicamycin, and blotted for the indicated proteins to illustrate the stoichiometry of catenins complexed with glycosylated and deglycosylated N-cadherin. For quantification, the catenin signal was normalized to the N-cadherin signal in the same lane.
