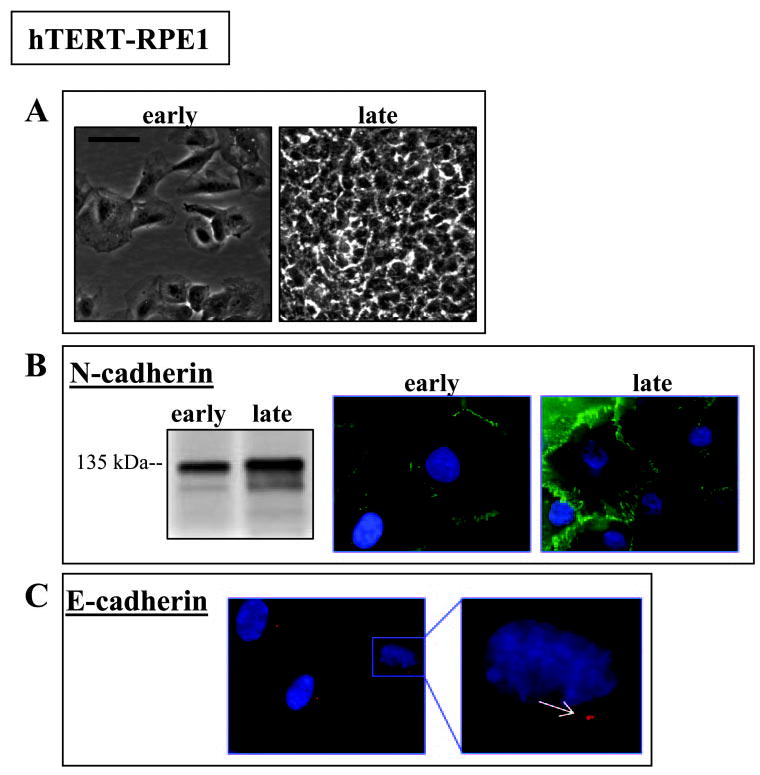
Figure 2.

Cell phenotype and N-cadherin in early and late hTERT-RPE1 cultures (24 hours or 7 days after plating, respectively). (A) Phase contrast microscopy showing a moderately epithelioid culture phenotype at both time points. Scale bar, 50 μm. (B) At both time points, protein blotting shows N-cadherin at the expected 135 kDa migration position, and immunofluorescence microscopy shows N-cadherin distributing to junctions. (C) Immunostaining for E-cadherin to illustrate localization to the centrosome in many cells where it may appear as a doublet (arrow, inset). For fluorescence micrographs, nuclei are counterstained with DAPI. Scale bar, 20 μm.
