Figure 3.

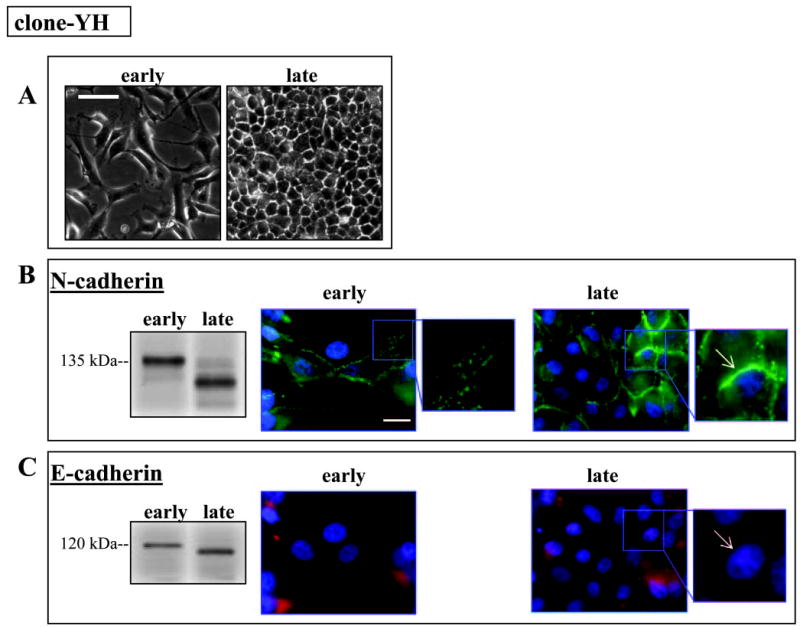
Cell phenotype and N- and E-cadherin in early and late clone-YH cultures (24 hours or 7 days after plating, respectively). (A) Phase contrast microscopy showing fusiform phenotype in early cultures and epithelioid in late cultures. Scale bar, 50 μm. (B) Protein blots showing N-cadherin at its expected 135 kDa migration position in early cultures and at a lower mass in late cultures. In early fusiform cultures, N-cadherin has multiple distribution patterns, including at sites of cell contact and in a punctate pattern in cell processes (early culture, inset). In late epithelioid cultures N-cadherin localizes to junctions (late culture, inset arrow). (C) Protein blot showing E-cadherin shifting from its predicted position (120 kDa) to a lower mass between early and late culture. Immunolocalization of E-cadherin in cells co-stained for N-cadherin shows diffuse distribution of E-cadherin at both time intervals, with no junctional distribution in epithelioid late cultures (late culture, inset arrow). For fluorescence micrographs, nuclei are counterstained with DAPI. Scale bar, 20 μm. Nuclei are counterstained with DAPI.
