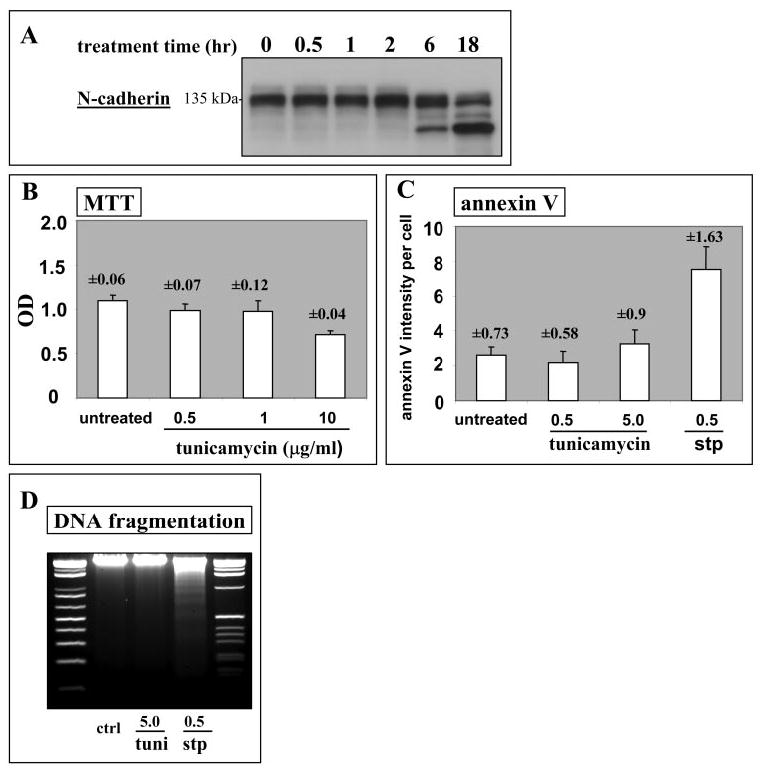
Figure 4.

Tunicamycin treatment of clone-YH cells. (A) Time course for protein deglycosylation induced by treatment with tunicamycin at 0.5 μg/mL, illustrated for N-cadherin. (B–D) Analyses showing that tunicamycin treatment at 0.5 μg/mL for 18 hours is not cytotoxic. (B) Cell viability by using the MTT assay for cells treated for 18 hours with a range of concentrations of tunicamycin. Data are means (error bars and numbers in the figure indicate SD) for 20 replicate culture wells per group from a representative experiment. (C and D) Analyses for apoptosis by using annexin V staining (C), and DNA fragmentation (D) showing a comparison of 18-hour treatment with tunicamycin (tuni) to the known apoptosis inducer staurosporine (stp). Concentrations are given in μg/mL. For annexin V staining, data were obtained as described in the Materials and Methods section and are mean staining intensities per cell in arbitrary units (error bars and numbers in the figure indicate SD). For DNA fragmentation, the first and last lanes show DNA standards.
