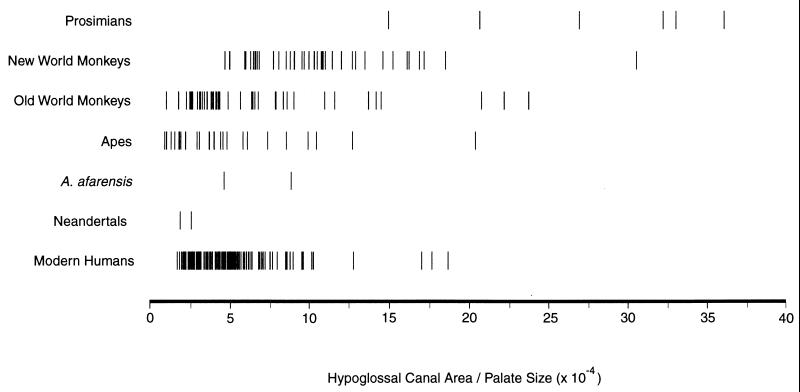
Figure 2.
Plot of hypoglossal canal cross-sectional areas relative to palate size (palate length × palate breadth × palate depth). The distributions are almost the same if oral cavity size is used instead of palate size (the two are correlated at a level of 0.95), but the sample size is smaller because some specimens lack mandibles. The Neandertal palate sizes (La Chapelle aux Saints, La Ferrassie 1) were measured on casts, and so are approximate values only. The palate size of the La Chapelle specimen is almost certainly artificially low because of alveolar resorption (i.e., the point should likely be even further to the left on the plot).

