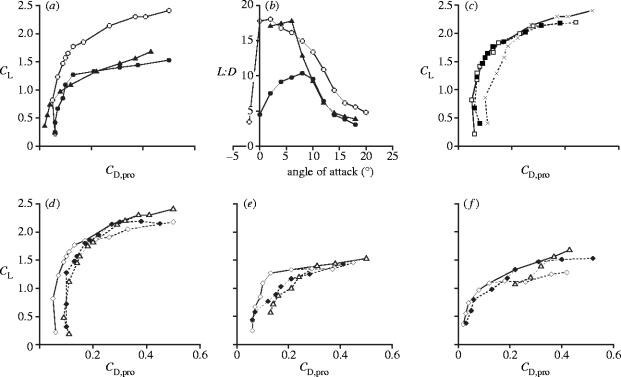
Figure 3.
Wind tunnel results for the pterosaur wing sections. (a) Polar diagram, in which the lift and profile drag forces measured for each model have been converted into their respective dimensionless coefficients, CL and CD,pro (equations (4.1) and (4.2)), and plotted against each other. Each point represents a CL and CD,pro value measured at a single angle of attack, and angle of attack increases from −2° at the bottom left to 20° at the top right. Open circles, broad forewing model; closed circles, narrow forewing model; triangles, model without a forewing. (b) L : D ratios. Symbols as in (a). (c) Polar diagram showing the effects of variation in θpd on the performance of the broad propatagium model. Open squares, θpd=30°; closed squares, θpd=40°; crosses, θpd=50°. The solid line indicates the best performance over the entire angle of attack range, and it is this composite polar for the broad propatagium model that has been plotted in (a). (d–f) Polar diagram showing the effects of variation in ϵ on the performance of (d) the broad propatagium model, (e) the narrow propatagium model and (f) the model without a propatagium. Open diamonds, ϵ=0.02; closed diamonds, ϵ=0.04; open triangles, ϵ=0.06. The solid lines again indicate the best performance, and are plotted in (a).

