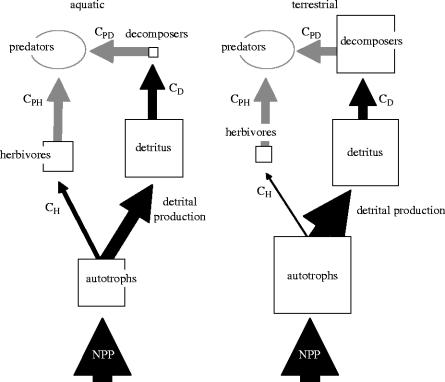
Figure 1.
Differences in pathways of carbon flow and pools between aquatic and terrestrial ecosystems. The figure summarizes the patterns demonstrated in Cebrian (1999, 2004) and Cebrian & Latrigue (2004). The thickness of the arrows (flows) and the area of the boxes (pools) correspond to the magnitude. The size of the pools are scaled as log units since the differences cover four orders of magnitude. The C's indicate consumption terms (i.e. CH is consumption by herbivores). Ovals and arrows in grey indicate unknown quantities.

