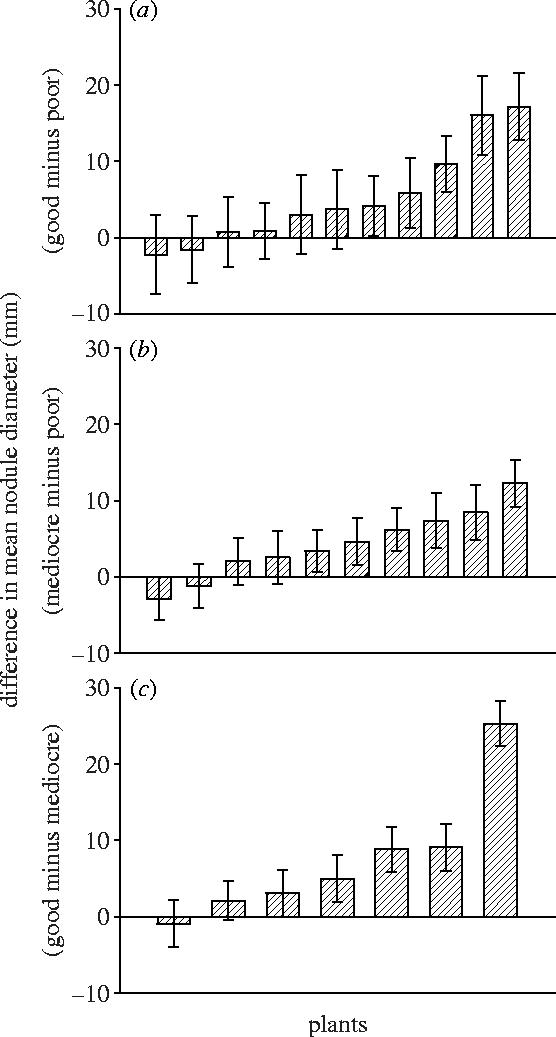
Figure 1.

Within plant average difference in sizes of nodules occupied by best versus worst strain. Plants inoculated by (a) strains LB16-1 (good) and LA11-1 (poor), (b) strains LA17-1 (mediocre) and LA11-1 (poor), (c) strains LB16-1 (good) and LA17-1 (mediocre). Bars indicate 1 s.e.
