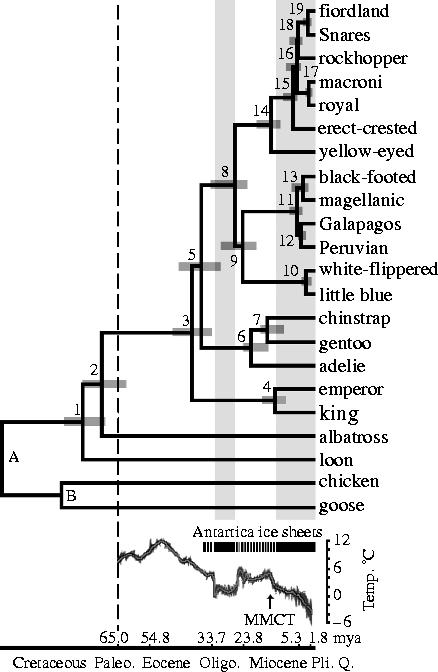
Figure 4.

Chronogram of penguin diversification. Nodes A and B were fixed at 104 and 90 myr. Credibility intervals (95%) are indicated by grey bars at numbered internal nodes. Vertical dashed line indicates the K/T boundary. Periods that Antarctica was ice-covered (black continuous bars) are projected as shaded grey rectangles in the chronogram. Ocean temperature is based on high-resolution deep-sea oxygen isotope records. The MMCT is indicated by an arrow. Geological time scale is given as defined by the Geological Society of America.
