
Figure 4.
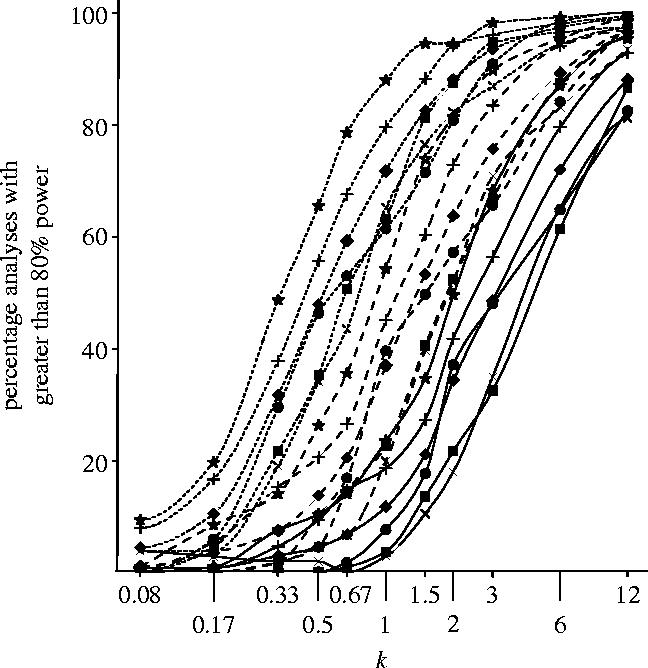
Percentage of analyses with ≥80% power for various multiples, k (plotted as log k), of n (number of fields, see table A2 of the electronic supplementary material), and three values of the multiplicative treatment effect, R=1.3 (solid line), 1.5 (dashed line) and 2 (dotted line), for groups of indicators corresponding to primary FSE papers and for all 531 indicators combined (symbols as in figure 3). The number of analyses with ≥90% power is given in table A3 of the electronic supplementary material. Values for the observed sample (k=1) are summarized for both thresholds in table 2 of this paper.