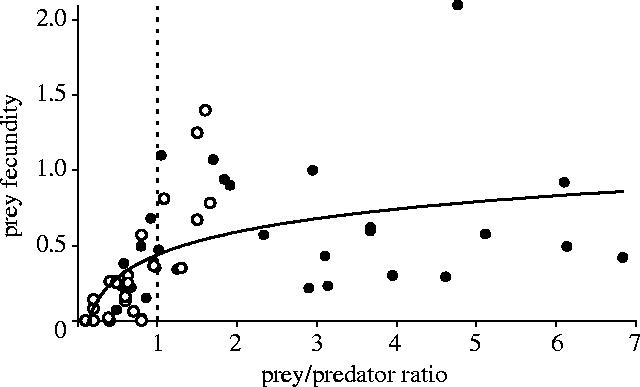
Figure 4.

Association between prey fecundity and the ratio prey/predator for the four-study local populations. Open circles show the relationship for the smaller populations (Columbretes and Alboran) and solid circles the relationship for the larger populations (Ebro Delta and Chafarinas). The solid line shows the logarithmic relationship between the two variables for the pooled data, which was statistically significant (F=60.8, d.f.=59, p<0.0001). The dashed line shows the threshold below which predator population was larger than prey population (see text).
