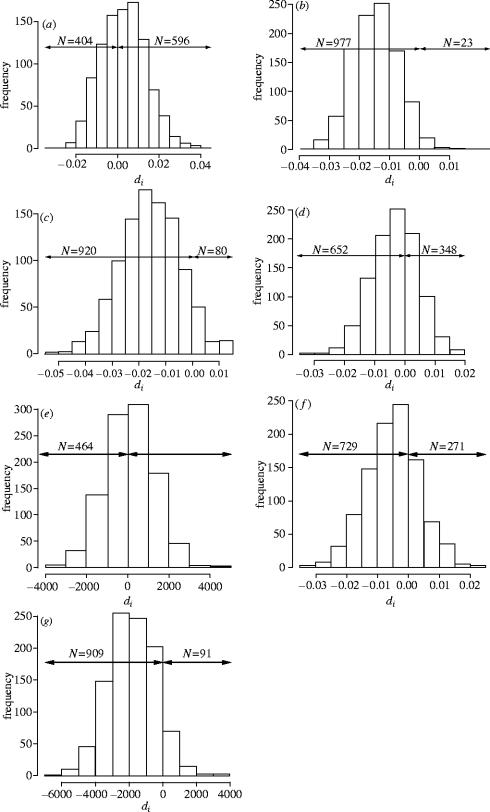
Figure 2.
Distribution of di for each test. di values are expected to be significantly greater than zero under the female-biased dispersal hypothesis. For each graph, the number of di values greater and lower than zero are indicated (N). (a) Genetic differentiation ar at the local scale, ; (b) genetic relatedness rw at the local scale, ; (c) genetic differentiation ar at the regional scale, ; (d) genetic relatedness rw at the regional scale, ; (e) geographic distances, ; (f) absolute residuals of the regression genetic distance/ln(geographic distance), ; (g) geographic distances of related individuals, . and are the mean genetic differentiations ar for males and females, respectively, for the ith resampling set; and are the mean genetic relatedness rw for males and females respectively, for the ith resampling set; and are the mean geographic distances for males and females respectively, for the ith resampling set; and are the mean absolute values of the residuals from the regression of genetic differentiation on ln(geographic distance) for males and females respectively, for the ith resampling set; and are the mean geographic distances of related individuals for males and females, respectively.

