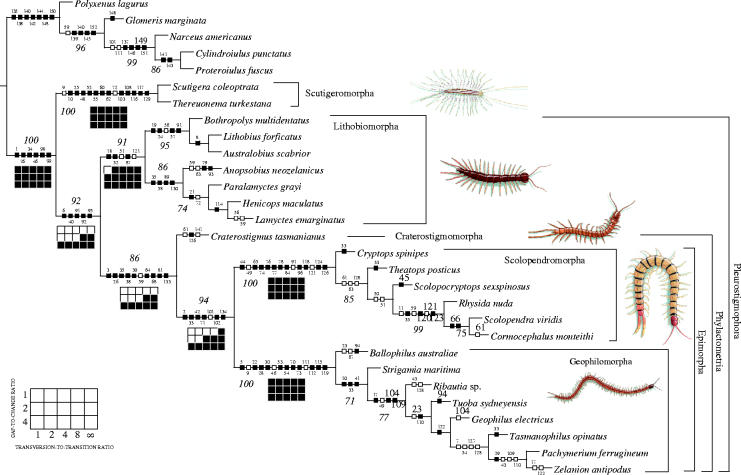
Figure 1.
Cladogram derived from parsimony analysis of the morphological dataset using a heuristic search with 1000 replicates of random addition sequence followed by TBR branch swapping, with character optimizations (boxes with small numbers) and jackknife frequencies greater than 70% (larger italic numbers). A second equally parsimonious cladogram inverts the placement of Ribautia and Geophilus. Character optimizations are represented by squares; solid squares indicate unique changes, open squares indicate homoplastic characters. Navajo rugs represent the sensitivity analysis for the combined analysis of all molecules and morphology for 15 analytical parameters (see parameter legend for Navajo rug in the lower left corner; black squares indicate monophyly, open squares represent non-monophyly). Centipede icons by Barbara Duperron.

