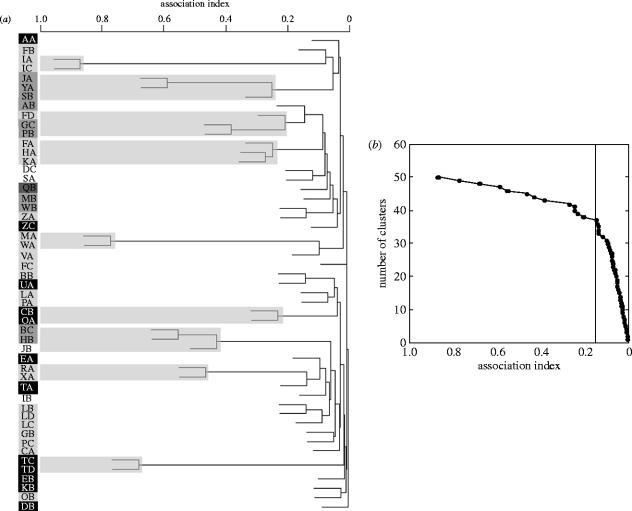
Figure 3.
(a) UPGMA tree of AI between 51 (out of 55) of the most frequently seen core social groups in Amboseli. Black and grey boxes on the left contain core group names and each greyscale combination represents a different mitochondrial DNA d-loop haplotype (black with white letters=AMB1, light grey with black letters=AMB2, dark grey with black letters=AMB3, dark grey with white letters=AMB4, and no box with grey letters=un-genotyped core group). Bond group clusters (defined in figure 2b) are encompassed by light grey boxes. (b) Plot of the accumulation of clusters (or nodes) on the tree in figure 2a as a function of association index. The vertical line at association index 0.17 indicates where the slope changes. The 13 points to the left of this are derived from all the clusters that comprise the nine bond groups in Amboseli.

