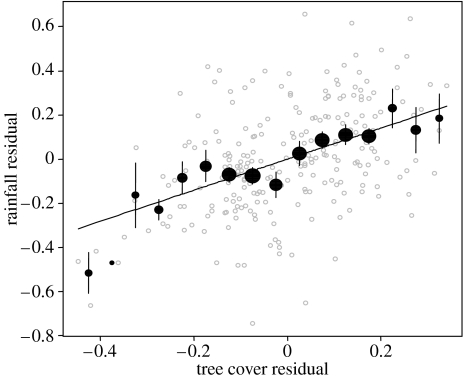
Figure 3.
The relationship between rainfall (mean annual rain days) and tree cover measured at the 1369 km2 scale for 237 climate stations in São Paulo state, after controlling for longitude, latitude and altitude. The values plotted (open symbols, light grey) are the residuals from a regression of rainfall on the three PCA-derived geographical variables (y-axis) and those from a regression of tree cover on the three PCA-derived geographical variables (x-axis). For clarity, the filled symbols show the mean of the rainfall residuals falling into each 0.05-unit tree cover residual bin, with vertical lines showing standard errors of the rainfall residuals in each bin; the size of each point is proportional to the number of observations in that bin. Analyses were performed on the ungrouped data, and the regression line shown is that from the analysis of all data. Its slope (0.703±0.092 s.e.) is equal to the partial regression coefficient linking tree cover to rainfall in the model including tree cover and the three geographical variables as predictors, and is highly significantly positive (d.f.=232, t=7.66, p<0.000 01).

