Figure 6.

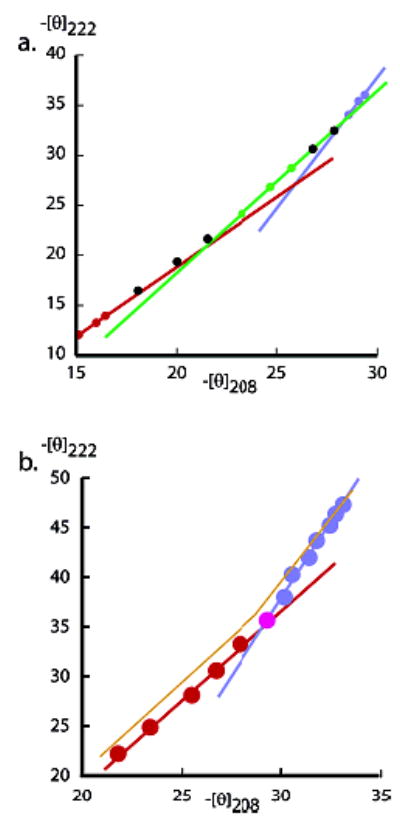
(a) A dual-wavelength parametric plot of cap-corrected [θ]222 vs [θ]208 measured in water for the series 1a peptide. Temperature is the implicit variable, and its range is 60–2 °C (respectively low and high −[θ] values), at intervals of 5 °C from 60 to 5 °C. Three local slopes are shown; 1.5 red; 1.8 green; 2.5, blue; each defined by three or four successive data points at high, medium, and low temperatures. The continuously increasing local slopes reflect the heterogeneity of helical lengths within the conformational ensemble. (The Ala28 spectra exhibit a 203 nm isoelliptic point.6) (b) Series 2 peptide βAspHel–Ala22–beta plot exhibits two regions of constant slope: 60–35 °C (red line and data points; C. C. = 0.997; slope 1.8) and 30–2 °C (blue line and data points; C. C. = 0.996; slope 3.2). Units: 103 deg cm2 dmol−1.
