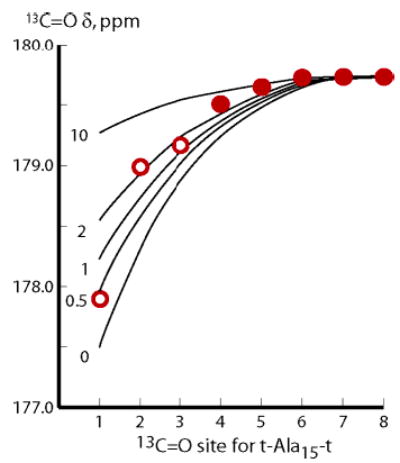
Figure 3.

Experimental 13C═O chemical shift values for tL-A15-tL, measured at 2 °C in water, red closed and open circles, compared with values calculated from eq 2. Required FHi values were calculated from a conventional L–R model with fixed w, adjusted to yield the experimental central residue chemical shift. The curves for j = c = 0, 1, and 10 thus correspond to the FHi values of the three Figure 2a–c. For each curve, w was normalized to yield 179.25 ppm for chemical shifts at sites 7 and 8.
