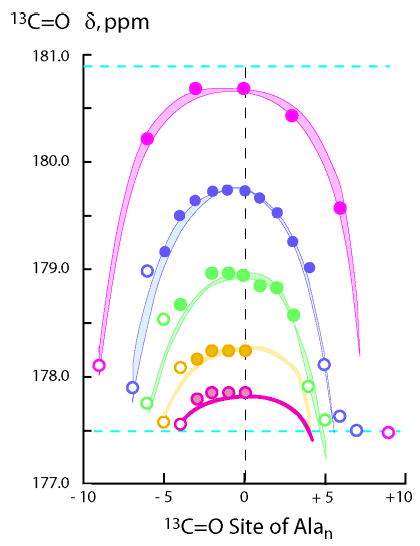
Figure 8.

Quantitative L–R modeling using eq 3 of site-dependent 13C═O chemical shifts measured at 2 °C in water for the tL-Alan-tL peptide series. Magenta, data points for n = 19; blue, n = 15; green, n = 13; orange, n = 11; pink, n = 9. The cyan dotted lines show the limiting chemical shift values for Ala residues that are fully helical, top, or nonhelical, bottom. Boundaries of each curved region correspond to L–R modeling for jLt = cLt = 0.3 and 0.5, each paired with its wAla(n) set.
