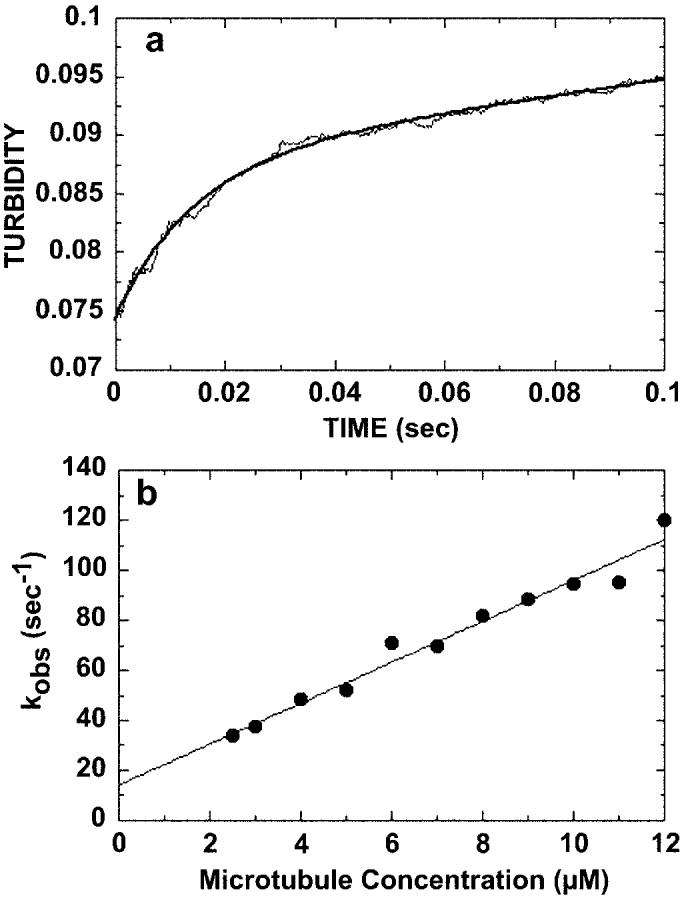
Fig. 3.

Kinetics of microtubule binding. 4 μm K401-4·ADP was rapidly mixed with varying concentrations of microtubules (2.5–12 μm), and turbidity was monitored in the stopped-flow apparatus. A, a representative stopped-flow record at 7 μm microtubules, which is the average of seven traces. The smooth line is the best fit of the data to a single exponential plus a linear term. The rate constant of the initial exponential phase is 70 ± 1.6 s−1. The second phase at a rate of 0.07 ± 0.001 s−1 is too slow to be considered on the pathway and is attributed to a conformational change after microtubule association. B, the rate constant from the initial fast phase of each transient was plotted as a function of microtubule concentration. The data were fit to Equation 2, the slope providing the apparent second order rate constant for microtubule association, k+5 = 8.2 ± 0.5 μm−1 s−1, and the y intercept providing k−514.3 ± 3.7 s−1.
