
Figure 5.
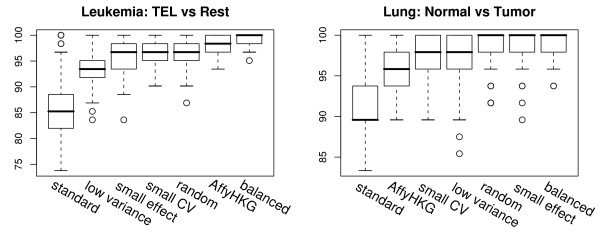
Classification accuracy using different normalization methods. Cross validation results of predictive performance of the same diagnostic signature used with different normalization strategies for diagnostic microarrays. The left plot shows classification accuracies for distinguishing TEL-AML1 from other groups in leukemia (ps = pn = 5). The right plot shows classification accuracies for distinguishing normal from adenocarcinomas in lung (ps = pn = 3). The boxplots are sorted by increasing median accuracy. When they have the same median the mean was used for sorting.