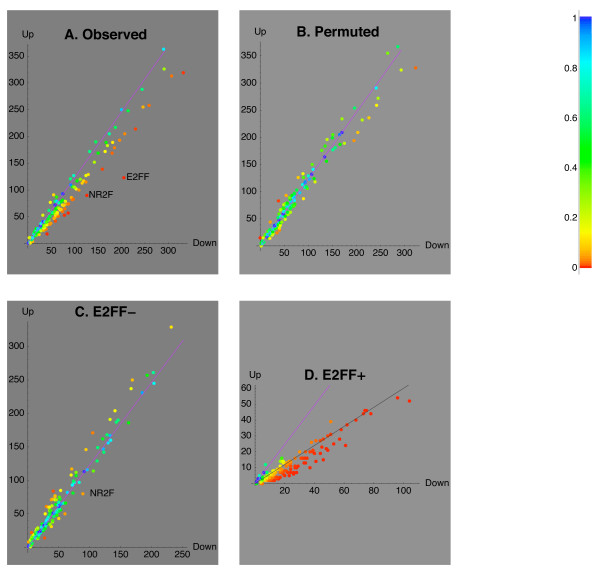
Figure 3.

Dominant effect of the E2FF motif. Distributions of the signs of loadings of Mode 2 (numbers of CNSs assigned to either sign of loading of Mode 2), in the sets of CNSs selected by the presence of each of the 148 motifs, in the hippocampal dataset. In the panels A-C, a dot represents a set of all the CNSs containing a particular motif, in D – a particular pair of motifs. The X coordinate of the dot is the number of CNSs in this set assigned to the negative sign of Mode 2 (a component of Down-regulation), and the Y coordinate is the number of CNSs in the same set assigned to the positive sign of Mode 2 (a component of Up-regulation). The associated single-test p-value is indicated by the color of each dot. The tangents of the two lines: violet, and black, indicate the ratio of the split expected under the H0 hypothesis, and the ratio observed for the set of CNSs selected by the presence of the E2FF motif. A. Distributions observed for each of 148 motifs, when analyzed in all CNSs. B. The same distributions as in A, for a randomized dataset in which the signs of the Mode 2 assigned to each CNS were randomly permuted. C. Distributions for each of the 147 motifs other than E2FF, analyzed only among the CNSs without E2FF. D. Distributions for each of the 147 motifs other than E2FF, as another motif in addition to E2FF, analyzed only among the CNSs containing the E2FF motif.
