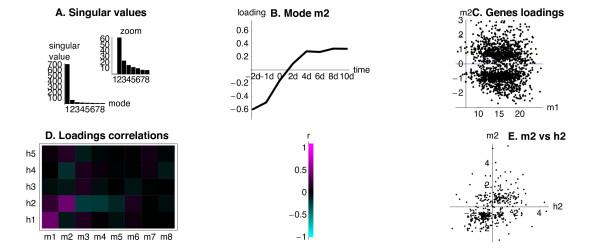
Figure 4.

Results of the SVD on the dataset from gene profiling of myoblast differentiation. The relevant part of the results of the SVD on the dataset from C2C12 myoblast differentiation in vitro, performed as described in Methods. A. The singular values for all 8 modes, and for the modes 2–8 to illustrates the importance of the second mode. B. Temporal profile (loading onto the time-points) of the second mode. C. Loadings of the myoblast modes 1 and 2 (marked m1 and m2) to the expression vectors of individual genes. D. Correlations between the loadings of modes resulting from the SVD on the myoblast dataset (marked m1–m8) and the modes resulting from the SVD on the hippocampal dataset (marked h1–h5) calculated for 454 common genes, represented in the colour scale. E. Loadings of the respective second modes resulting from the SVD on the myoblast (m2) and on the hippocampal dataset (h2) for the 454 genes common to both datasets.
