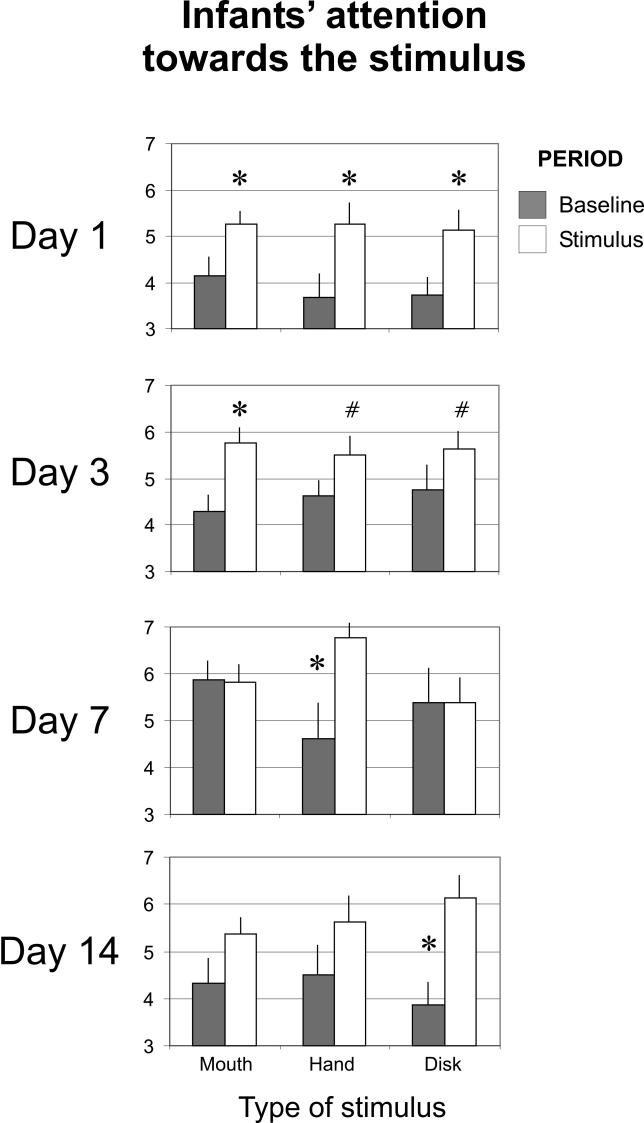
Figure 2. Frequencies of Looks That the Infants Oriented at the Stimulus during the Baseline and the Stimulus Period.
Asterisks (*) indicate a significant increase in number of looks (stimulus versus baseline) for a specific stimulus (at least p < 0.05). Pound symbols (#) indicate that this effect is close to statistical significance (p < 0.07). Because data concerning looks at models' LPS, MO, and TP were very similar, they were averaged and pooled. Frequencies are ± standard error of the mean.

