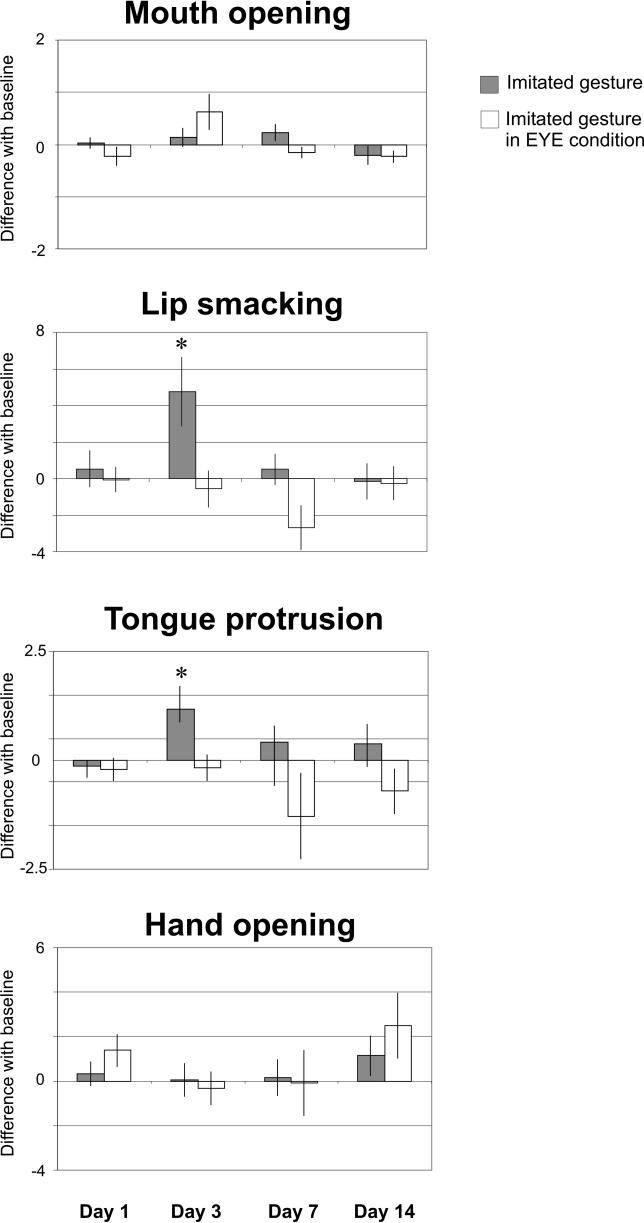
Figure 3. Averaged Scores of the Imitated Behaviors and the Same Behaviors Scored in the Control Condition (EYE).
Averaged scores are calculated as the difference between the frequency of the imitated behavior in the stimulus period and the baseline. The scores the infants obtained are reported in relation to age and to the different experimental conditions (MO, LPS, TP, and HO). Scores are ± standard error of the mean.

