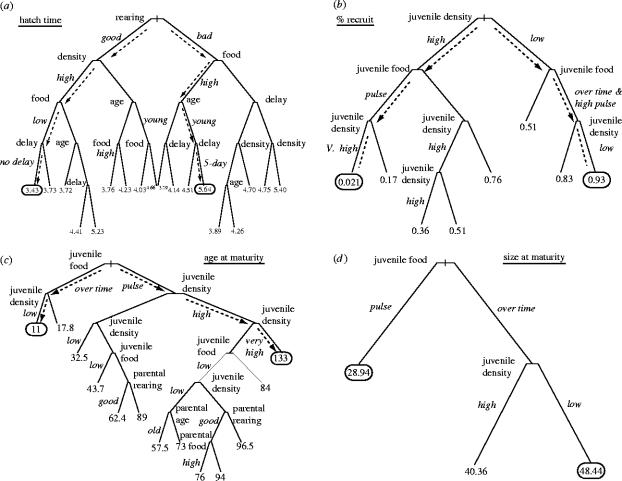
Figure 3.
Regression trees were used to partition the variation in predicted values from the statistical models for each life-history trait. They are presented to help describe the structure of our statistical models, in particular highlighting when and where maternal effects might influence offspring performance over and above offspring density and food. (a) Time to hatching; (b) percent recruitment; (c) age-at-maturity; (d) size-at-maturity. In each tree, the lowest and highest predicted value of each trait is circled. Dashed arrows correspond to the pathway by which the tree-building algorithm has split the data for the lowest and highest values. Small italic print designates the magnitude of a factor at a split point. For example, in tree A for hatch date, the left-hand set of arrows indicates a route to early hatching from good adult rearing through high adult density and low adult food and no delay in adult feeding. Alternately, bad rearing, high food, young mothers and a 5 day delay in feeding adults leads to the latest hatch date. All descriptions of traits are identified in §2.

